One portal. The whole workflow.
From the first signal of suspicious activity to a contained endpoint and a tuned detection rule, every step happens in the ZeroExfil portal.
See what's happening across your fleet.
Start every shift with the full picture: which endpoints are healthy, what's been alerted on, and where data is moving.
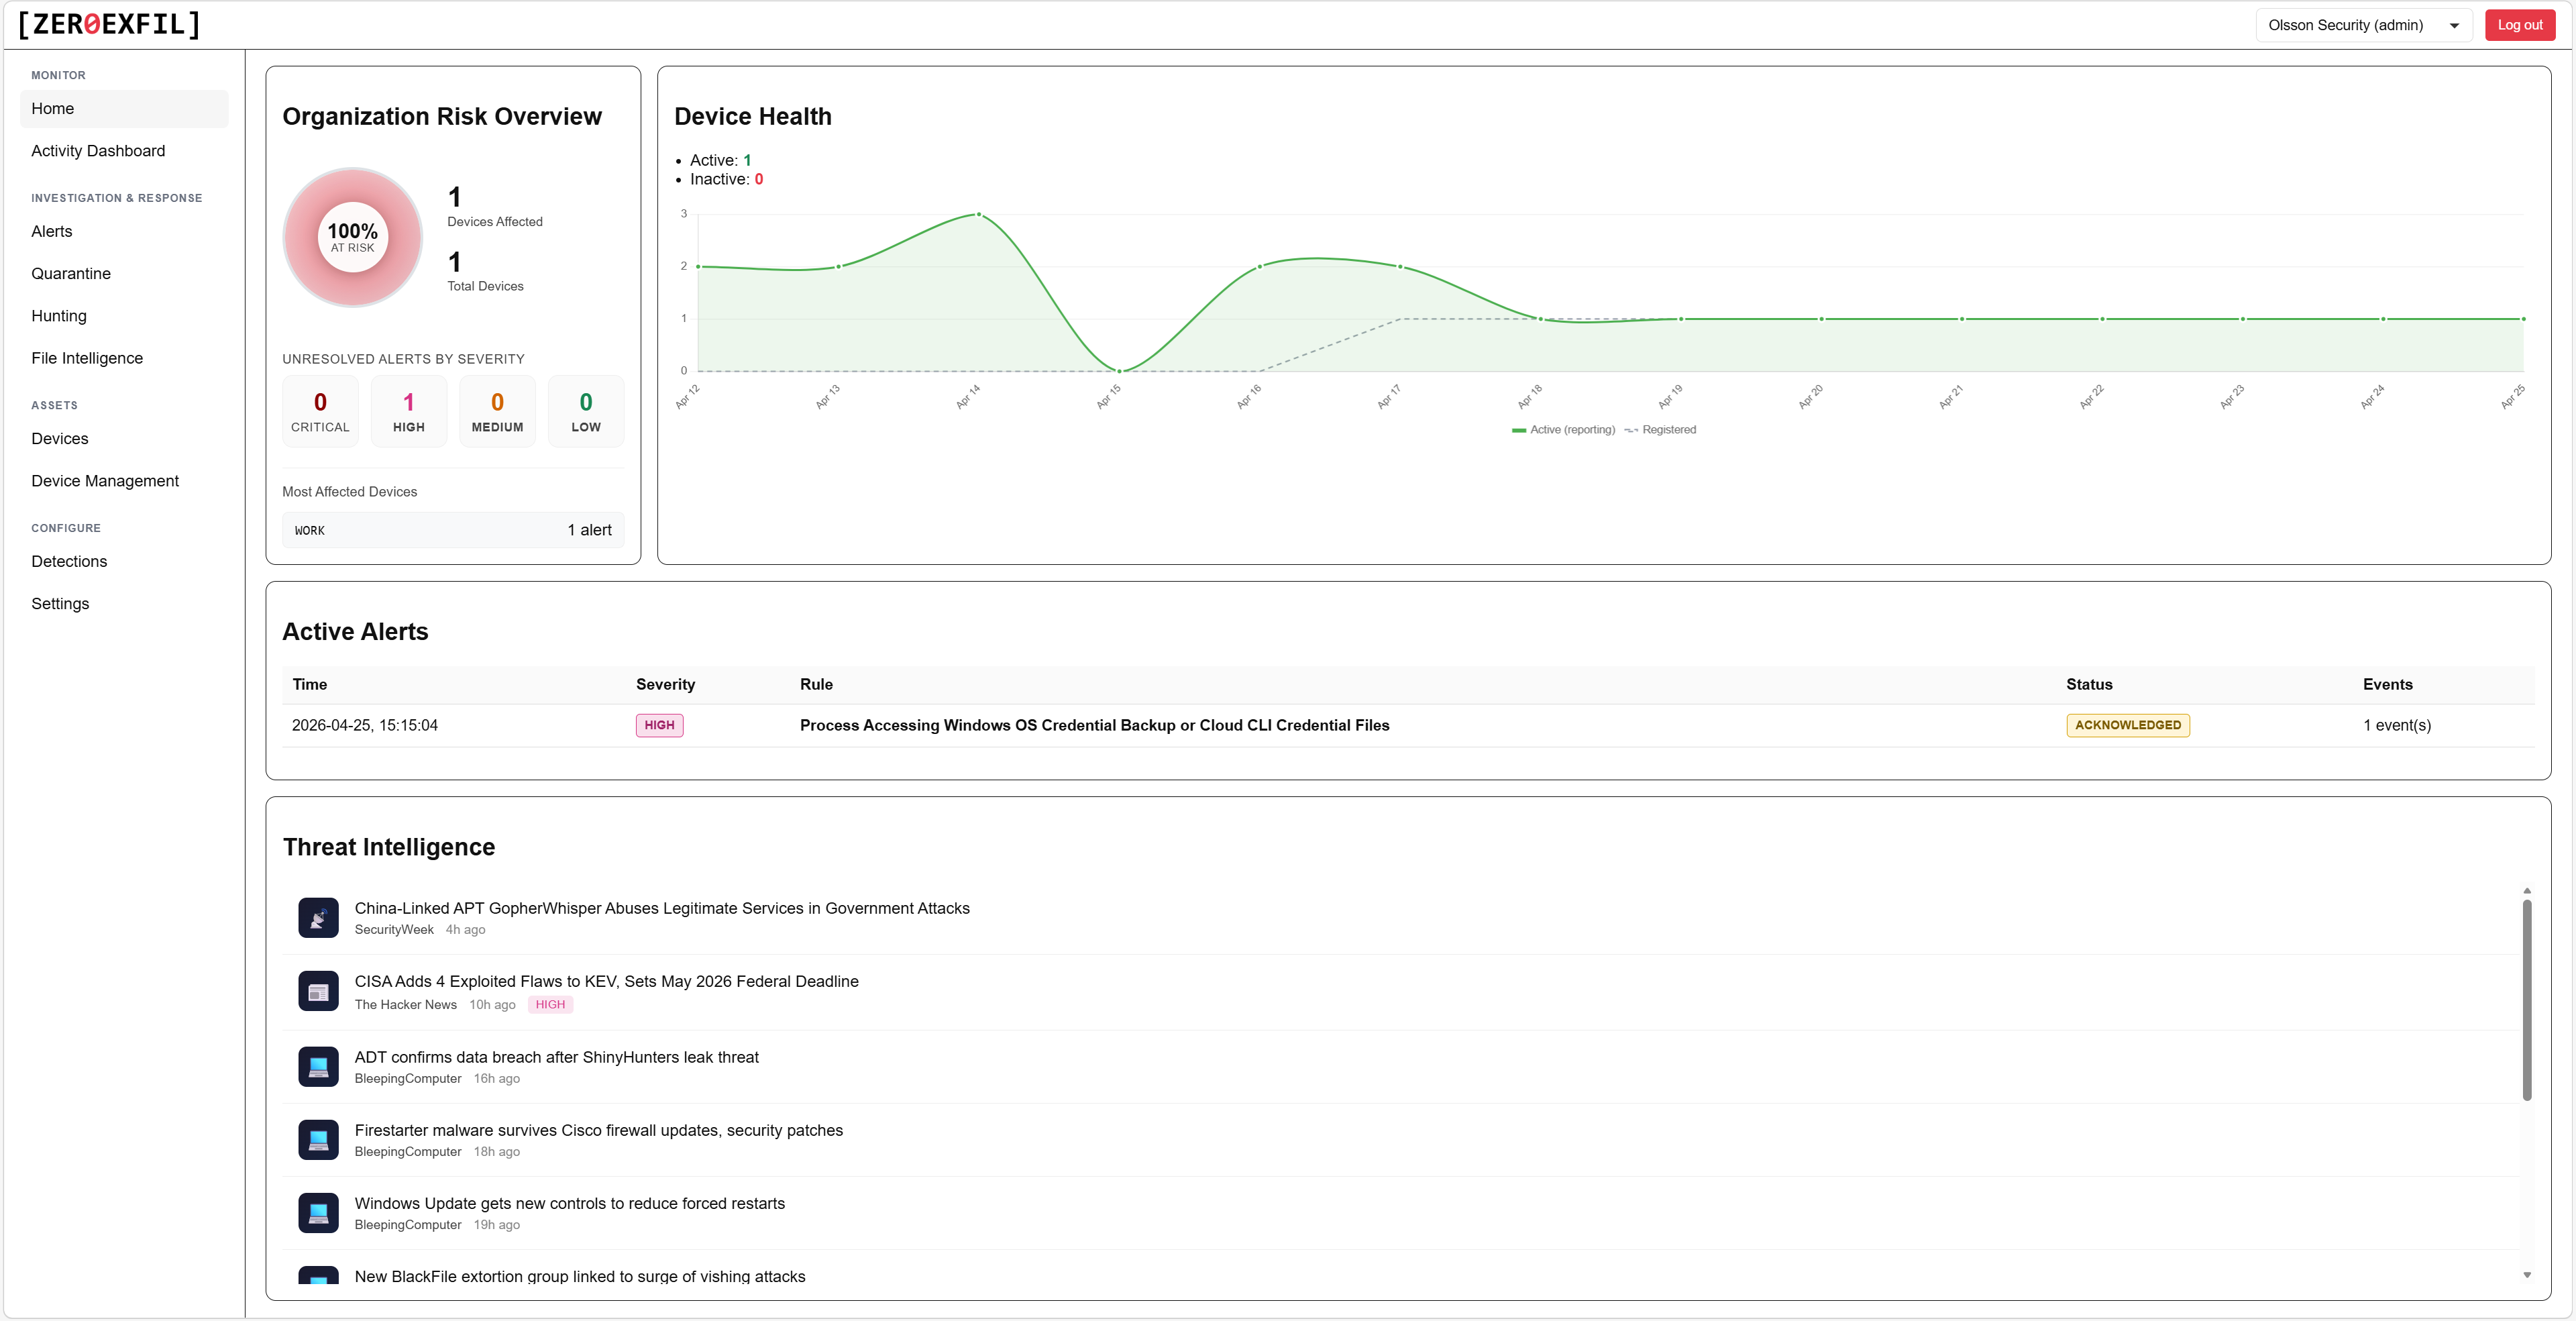
Home dashboard
Organisation risk, endpoint health, and active alerts in one view, with a live threat intelligence feed alongside.
- At-a-glance fleet health and risk score
- Active alert count by severity
- Live threat intelligence relevant to your environment
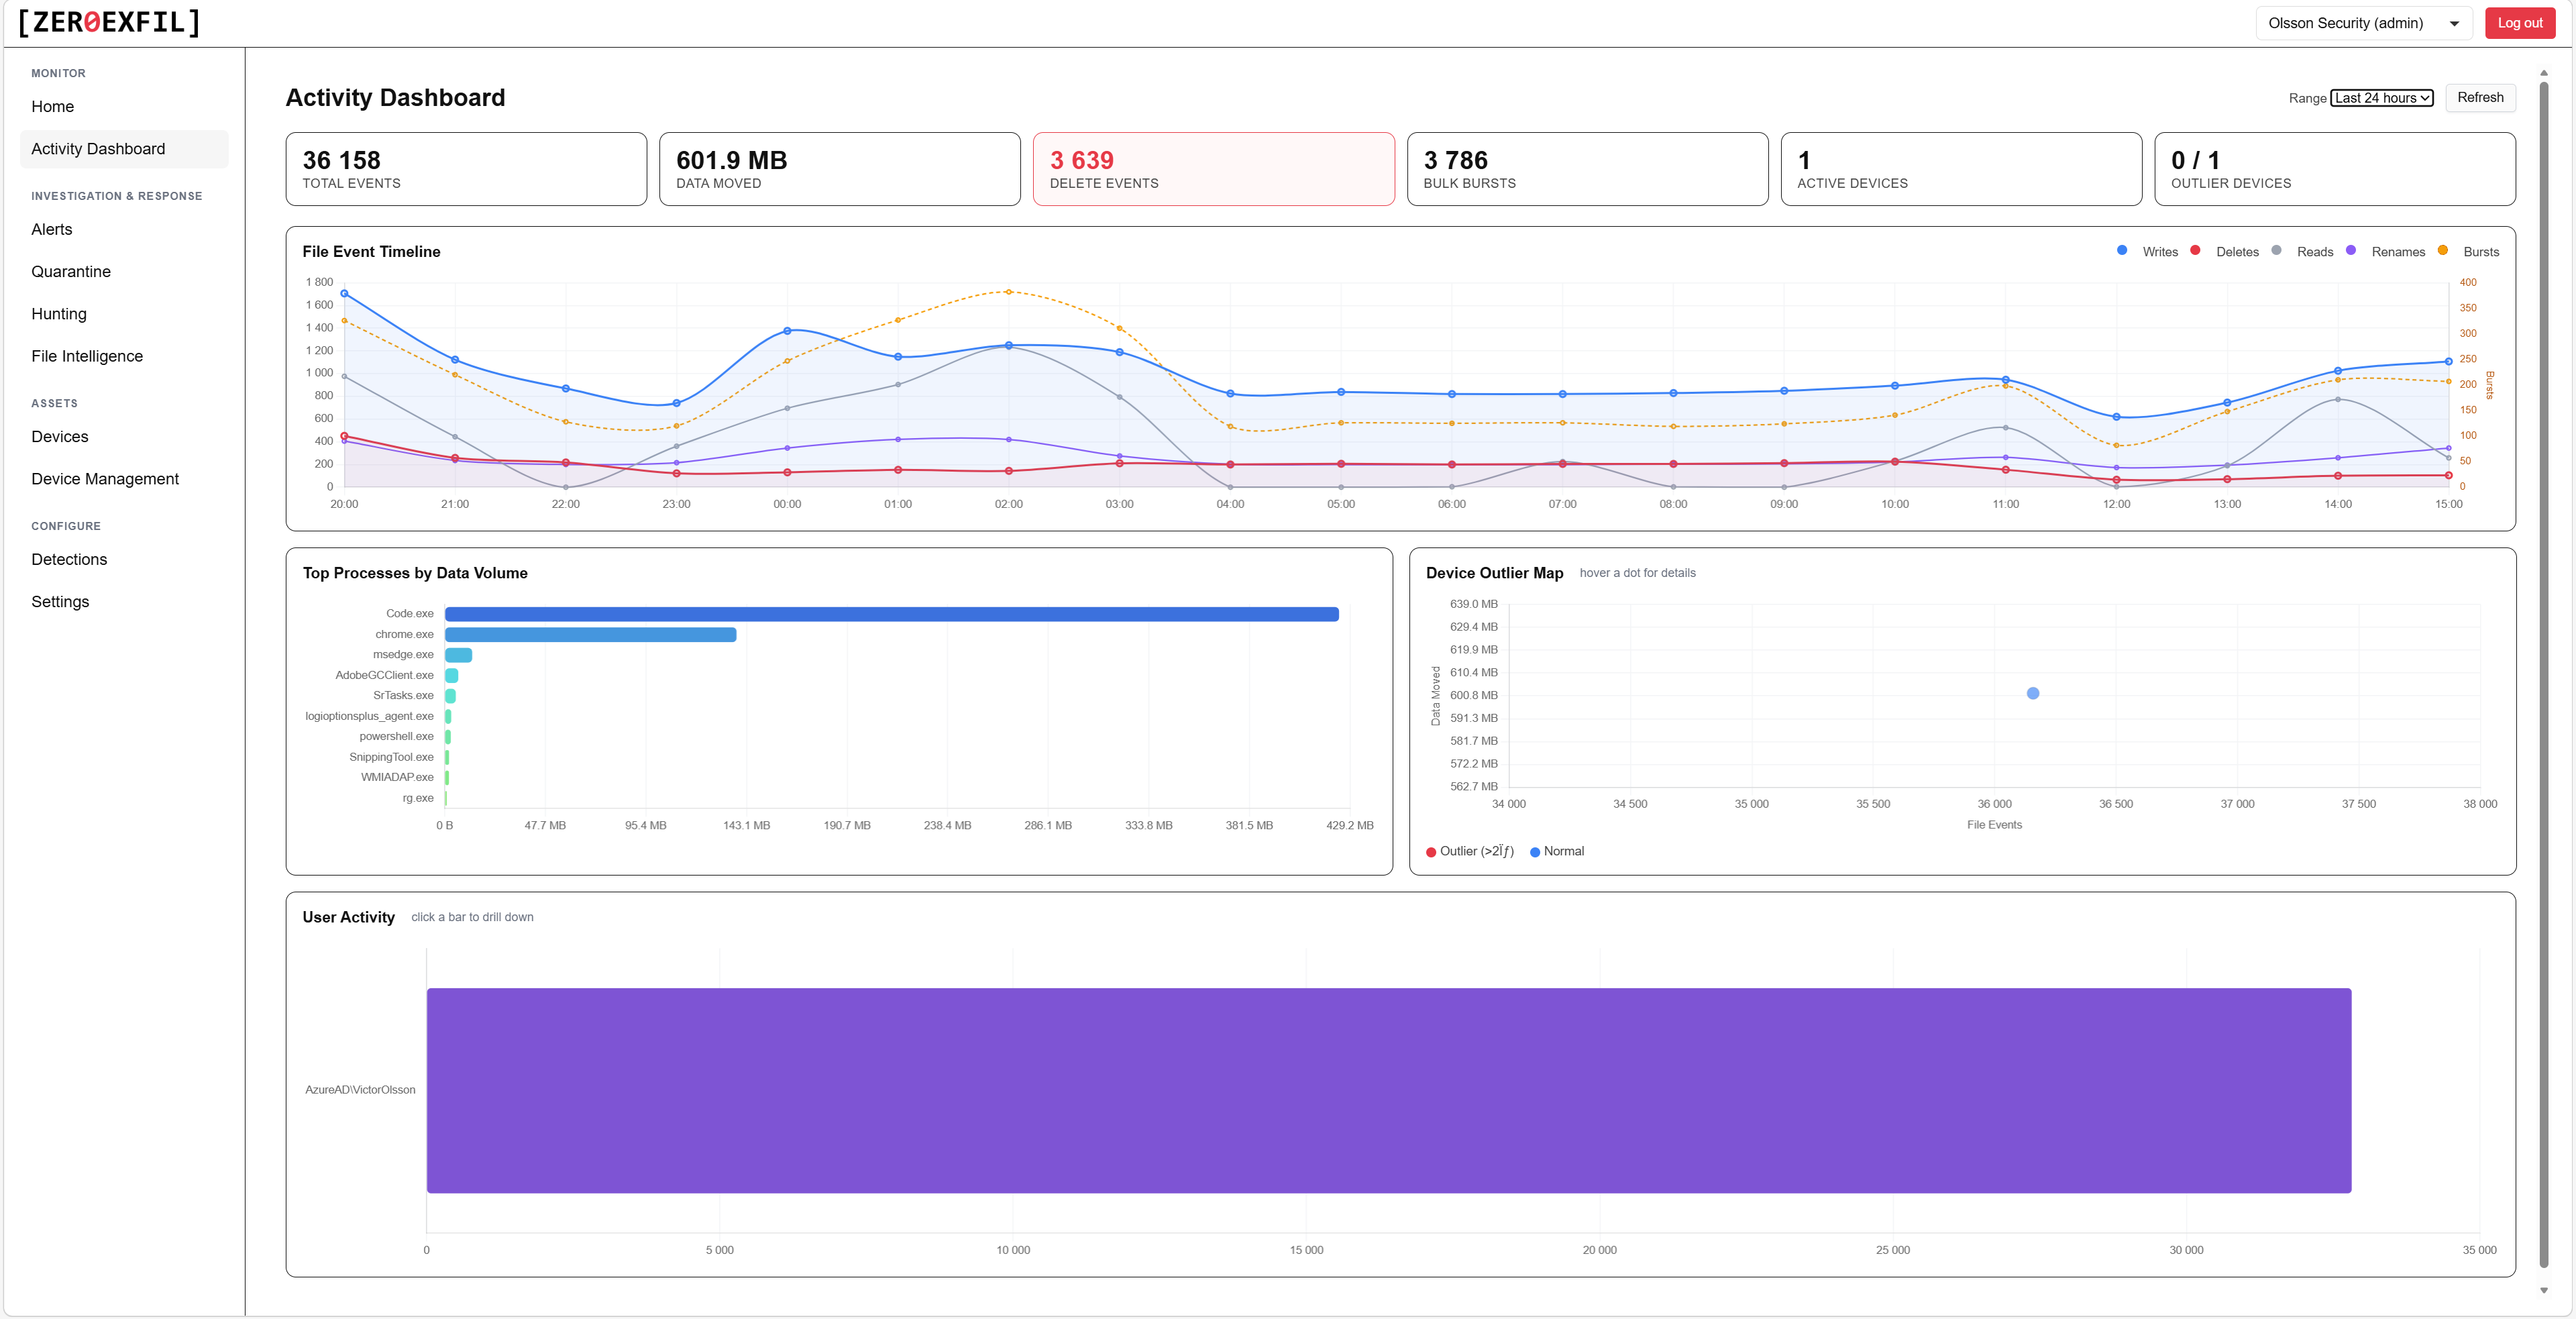
Activity dashboard
File event volume, data moved, top processes by data volume, and user activity across your fleet, with outlier devices flagged automatically.
- Spot devices doing more than they should
- Pivot to any device or user with one click
- Filter by time range and device group
Triage every alert without context-switching.
Severity, rule, endpoint, and status, all in one list. Open any alert to see the full file event timeline and the user, host, and process behind it.
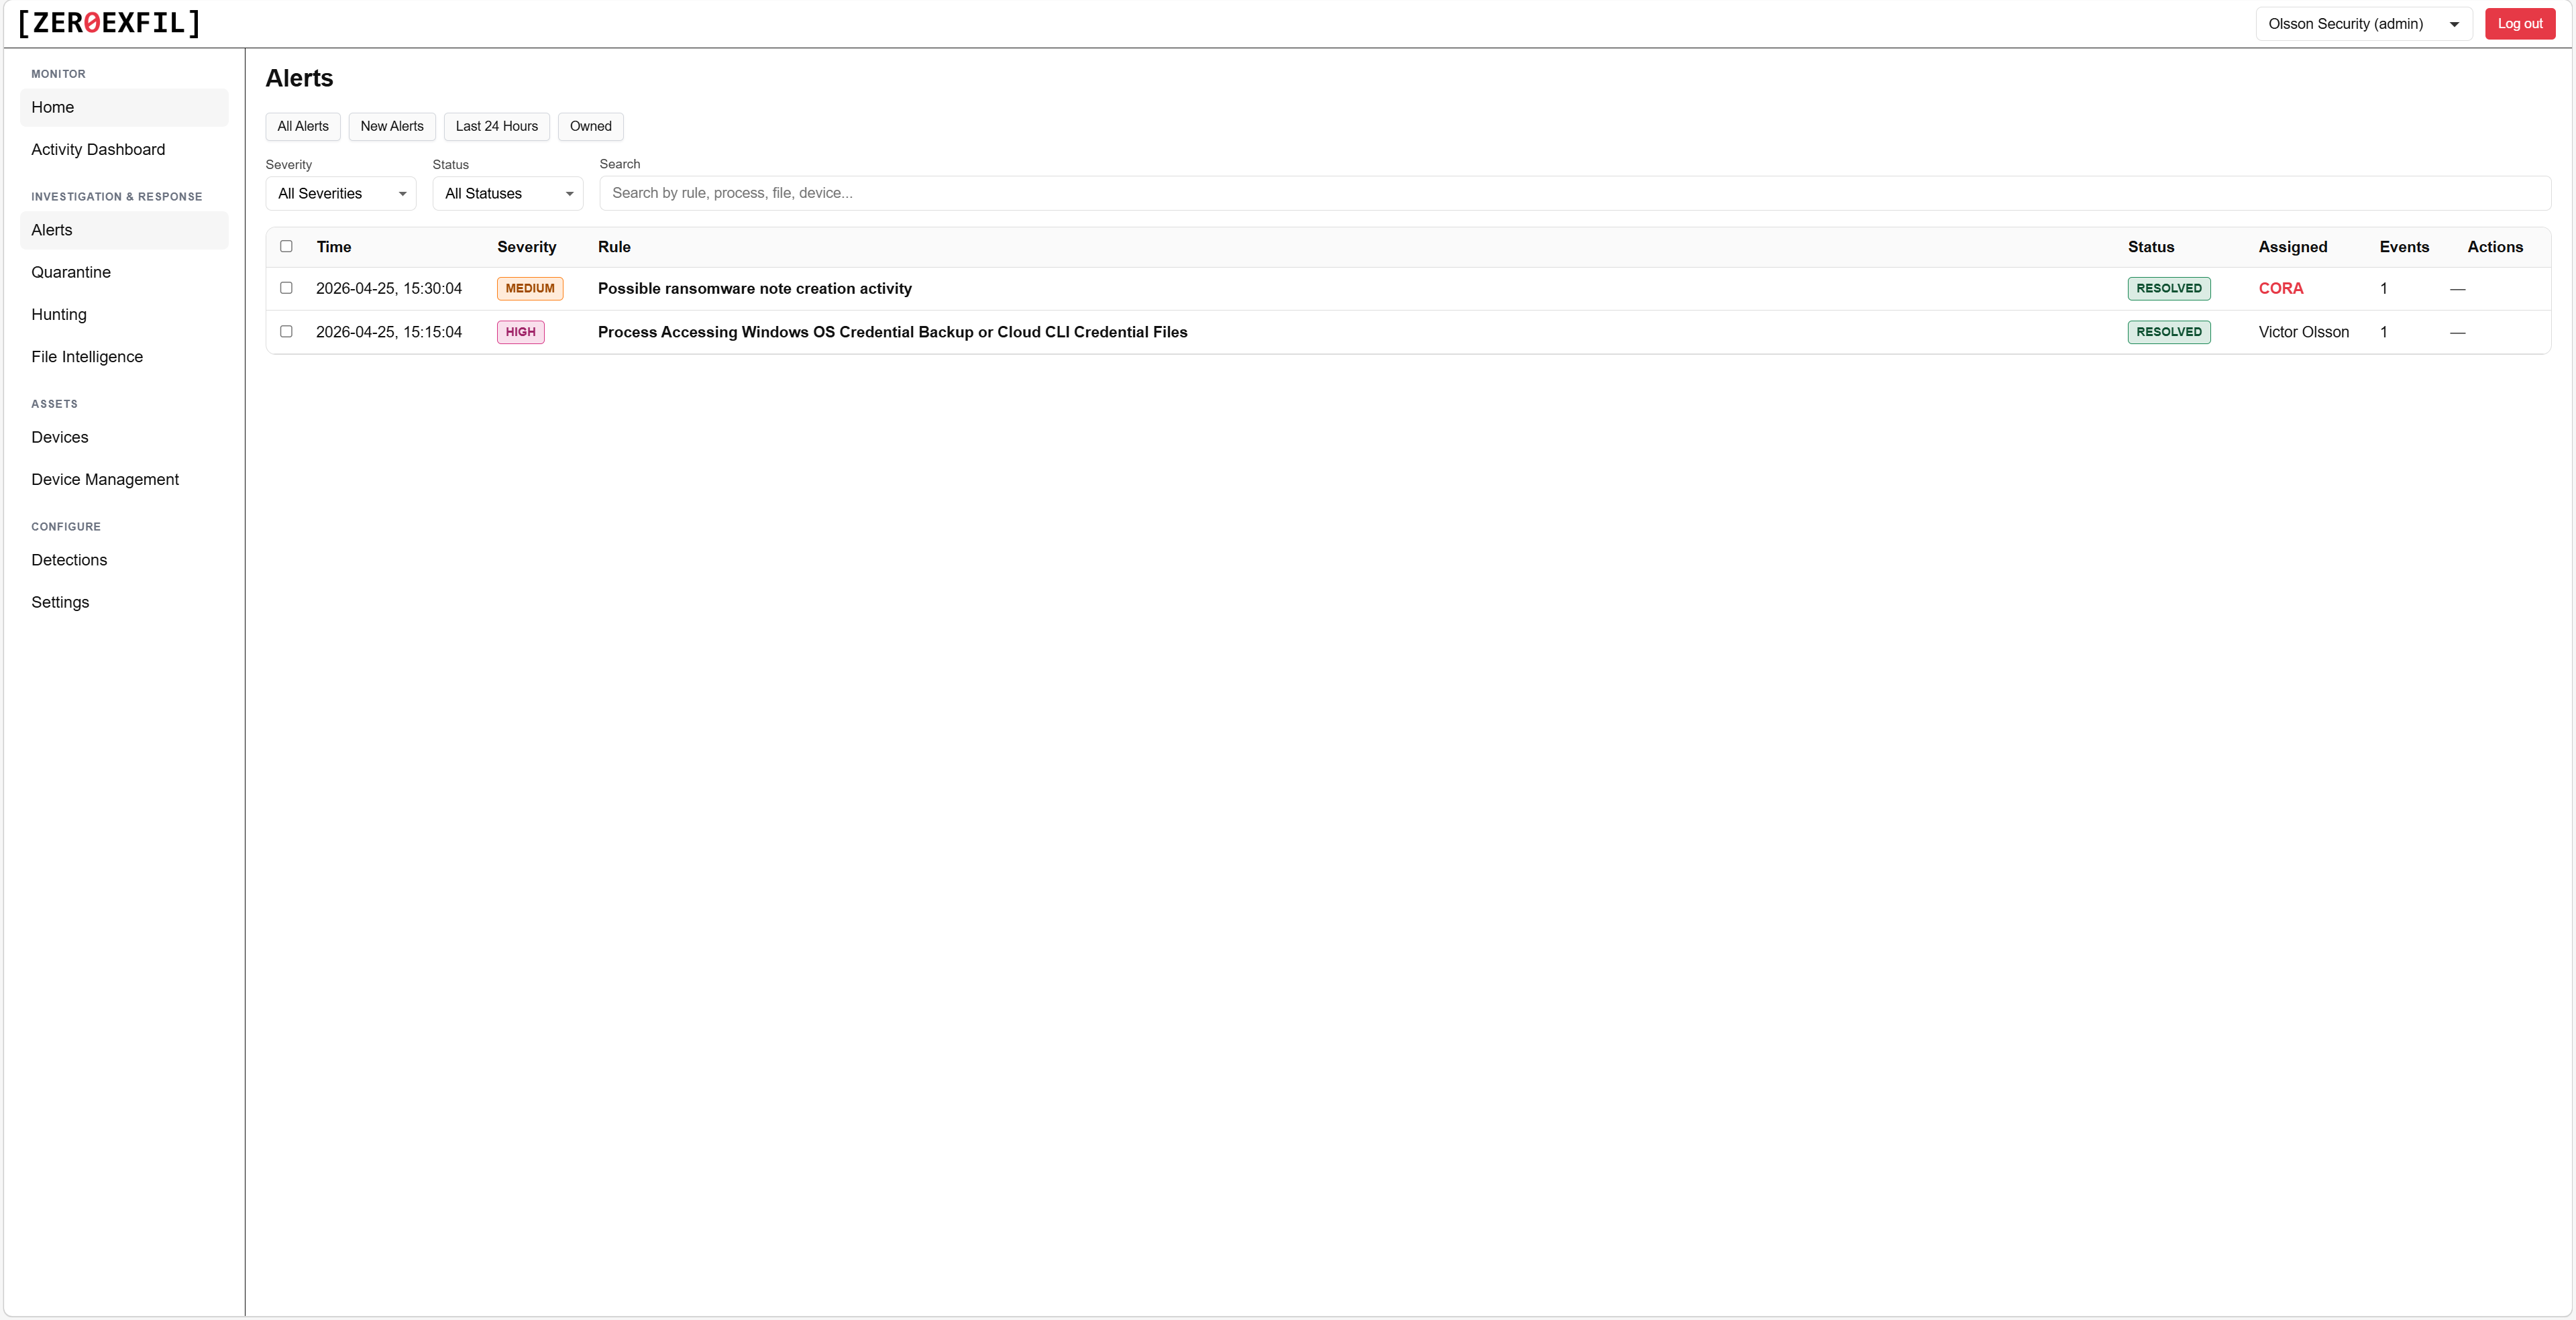
Alerts
Filter by severity, rule, endpoint, or status. Acknowledge or resolve in bulk from the list.
- Sort and filter on every column
- Bulk acknowledge or resolve
- Saved views per analyst
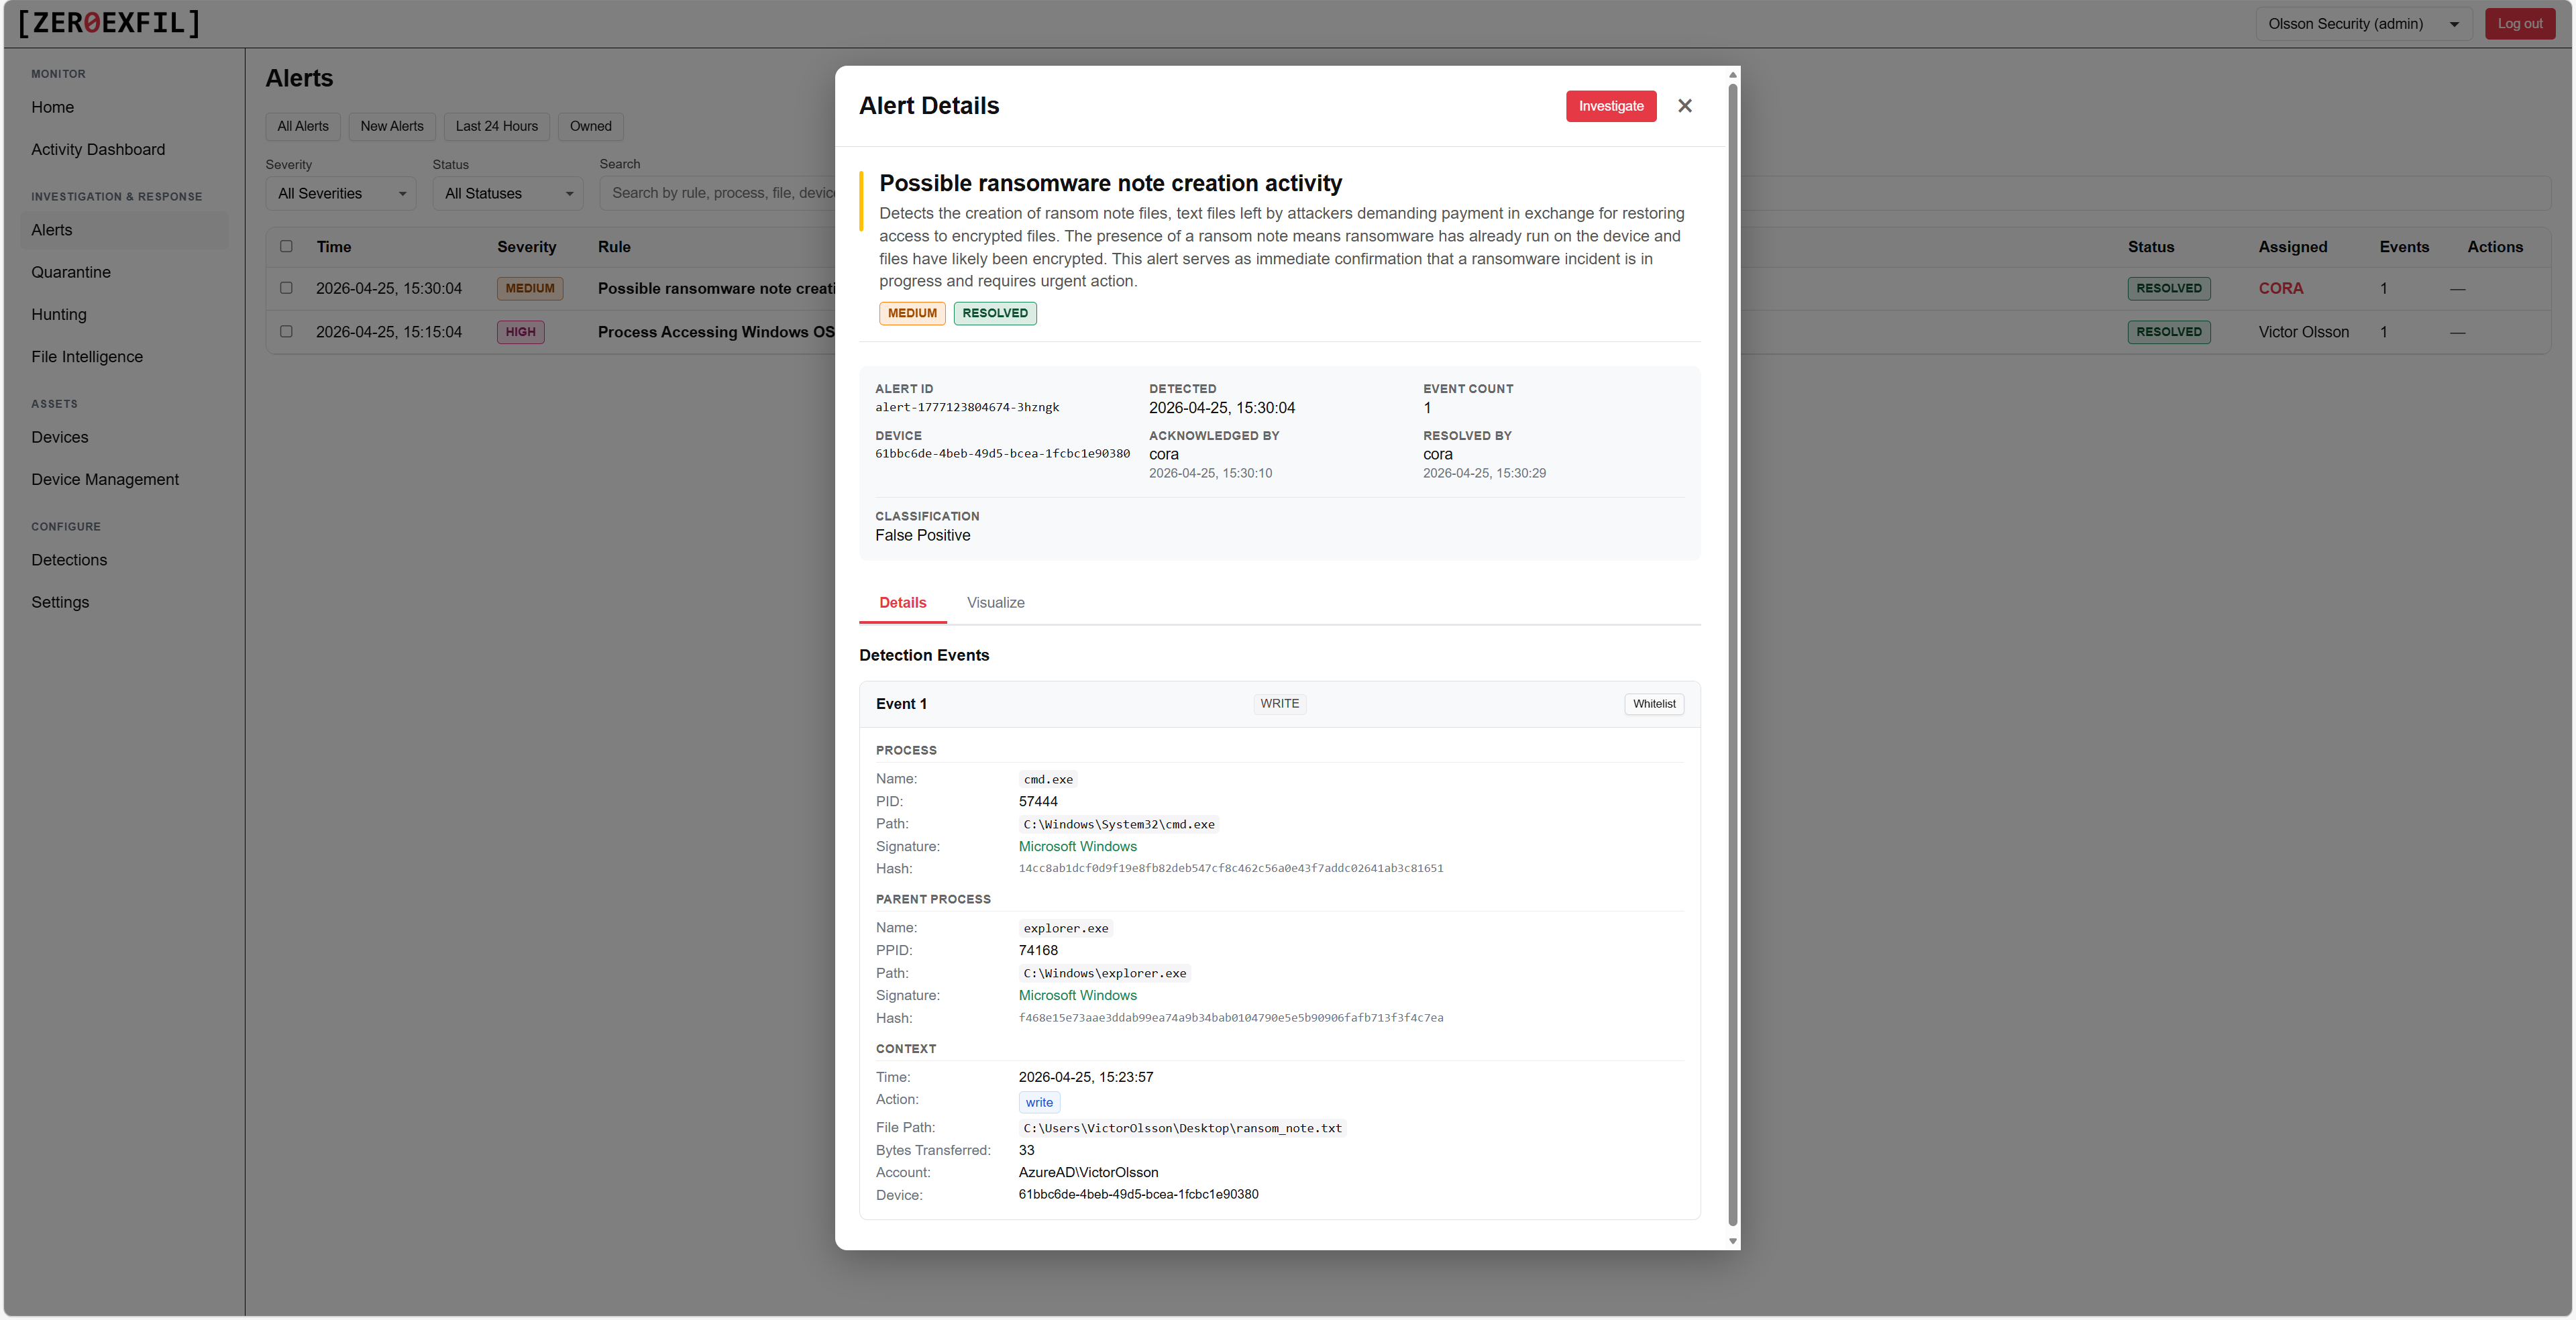
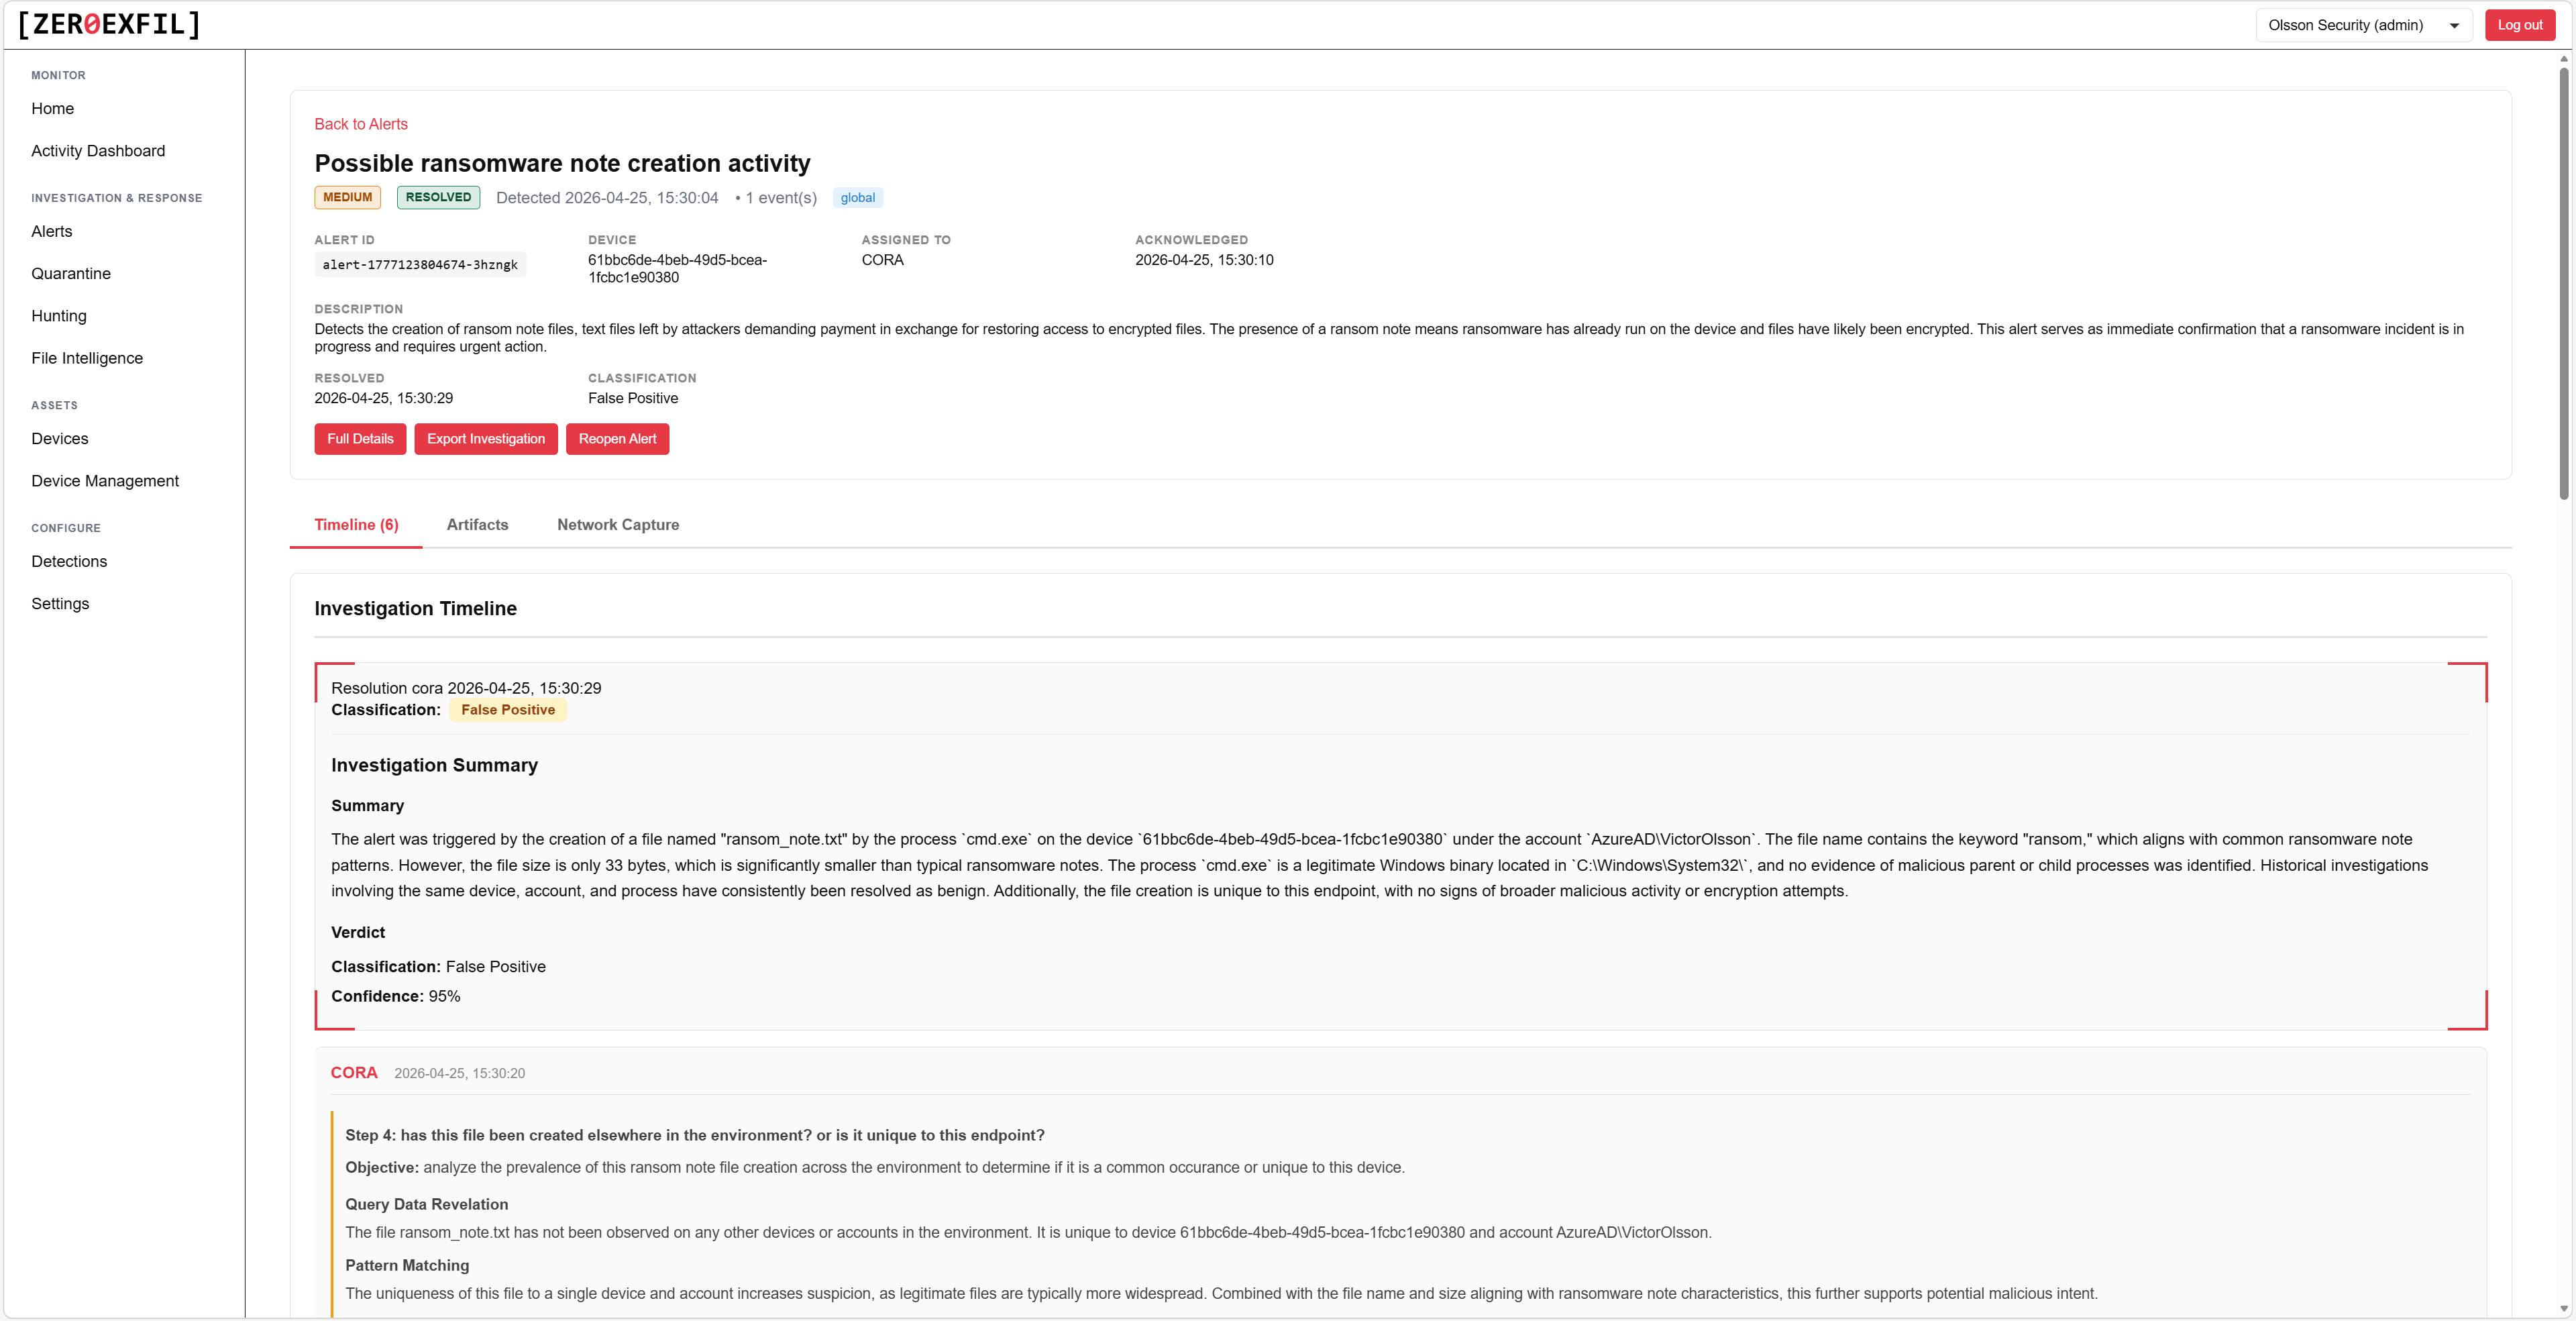
Alert details
The full file event timeline, process chain, and the user, host, and rule behind every detection, all in one view.
- Process chain reconstructed from the agent
- Linked file events with full metadata
- One-click pivot to the device, user, or rule
Every alert investigated by an AI analyst.
CORA, the Correlation Response Analyst, gathers the surrounding evidence, builds a hypothesis, and gives every alert a verdict and confidence score before a human ever opens it. It closes out normal business activity and benign noise on its own, and only escalates what actually needs your team, so you don't waste headcount on false positives.
Investigate without leaving the portal.
Document findings, look up files, query the fleet, and review captured network traffic, all in one place.
Investigations
Document findings, attach evidence, and track the workflow as your team works the alert from triage to resolution.
- Rich text notes with screenshot attachments
- Linked alerts, devices, and files
- Status and assignee per investigation
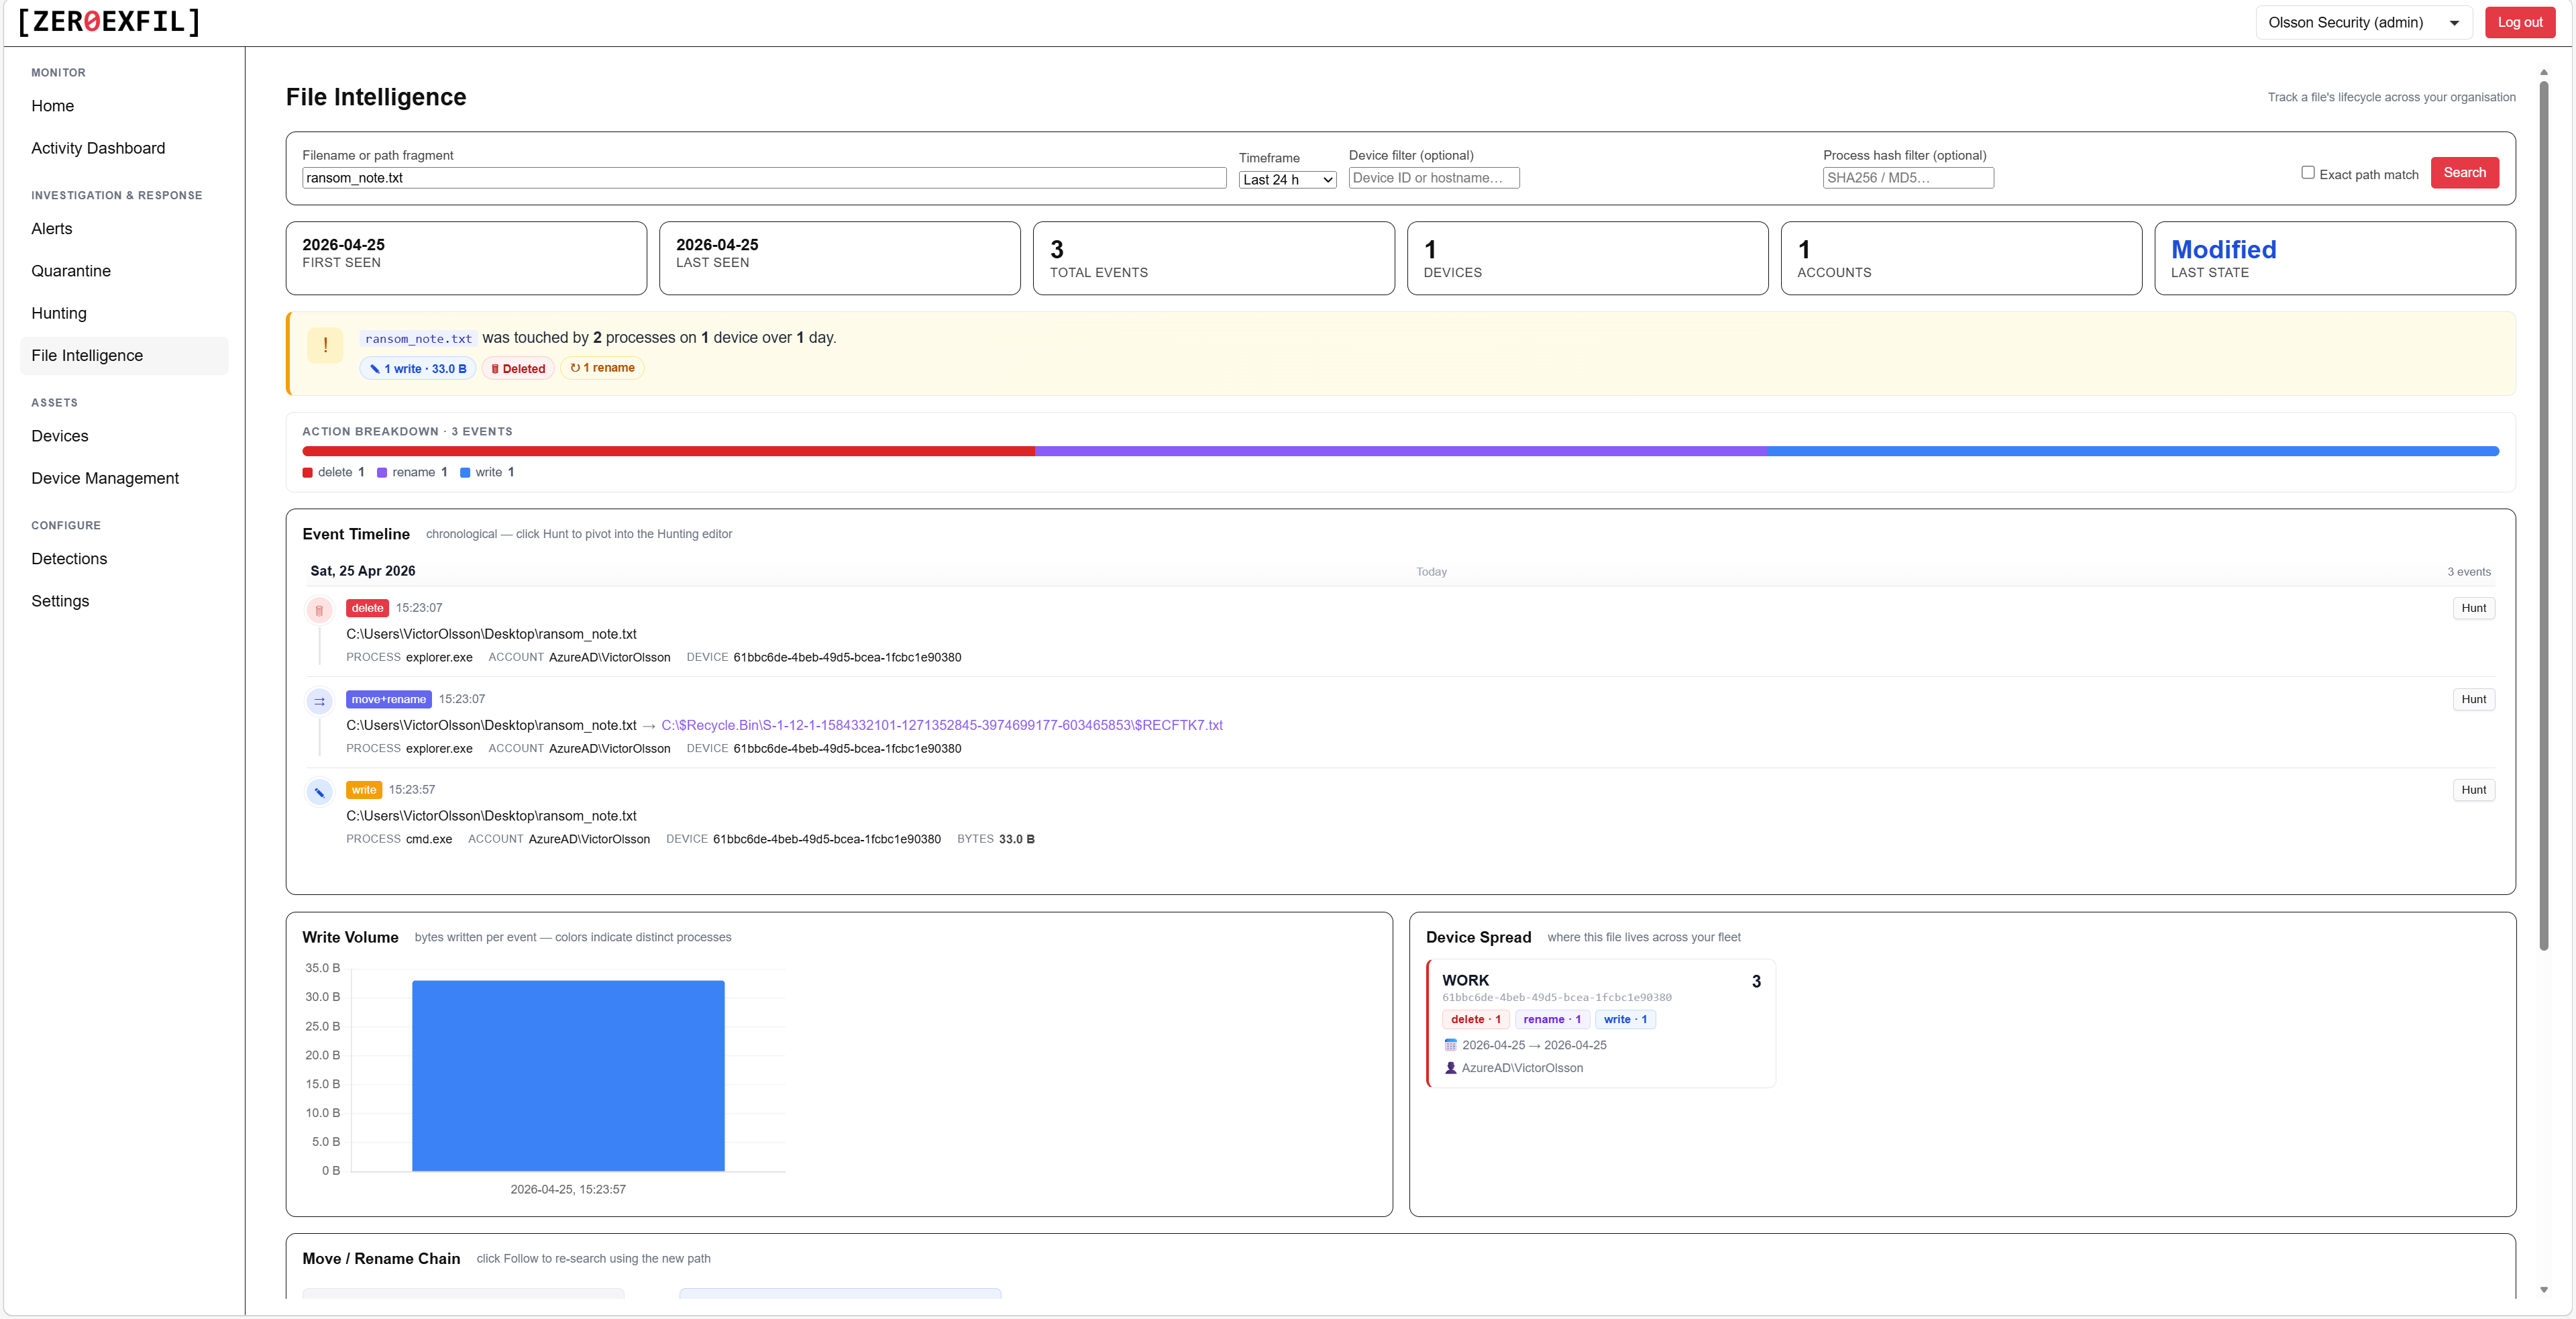
File intelligence
Reputation, signer, prevalence, and history for any file seen on your endpoints.
- Code signing chain and trust verdict
- Prevalence across your fleet
- First and last seen, by device
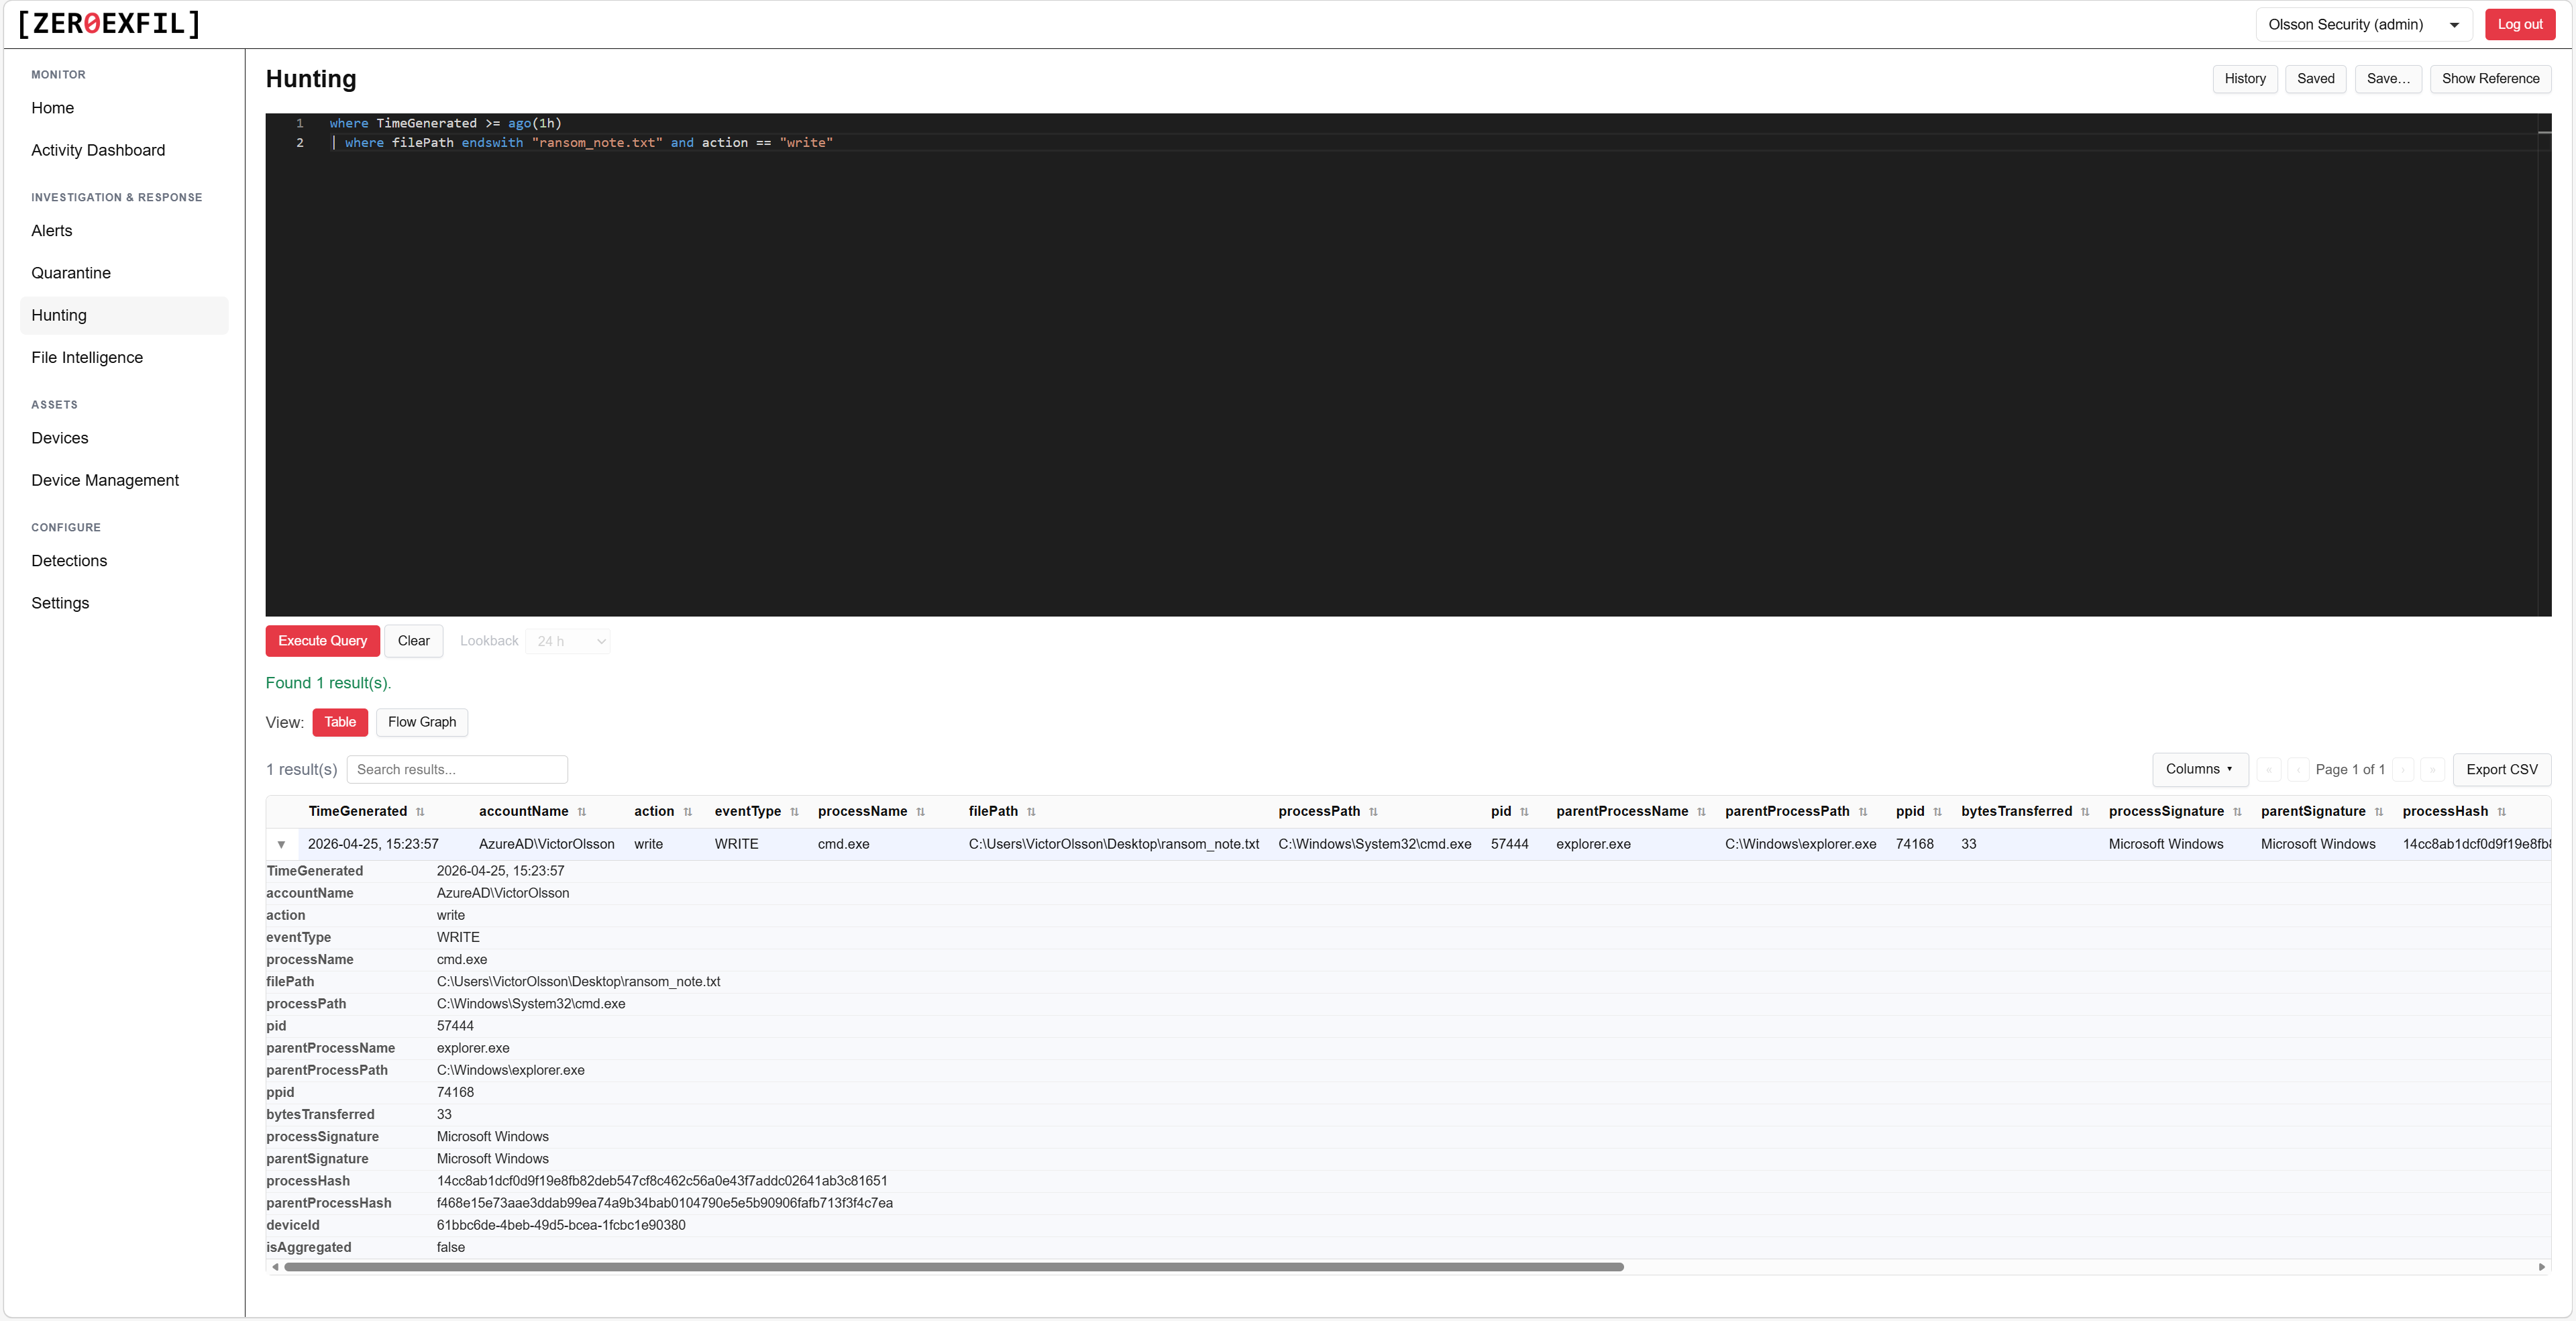
Advanced hunting
Query your endpoint telemetry to investigate incidents, run audits, and proactively hunt for threats.
- Schema documented inline in the editor
- Save and share queries with your team
- Export results to CSV or JSON
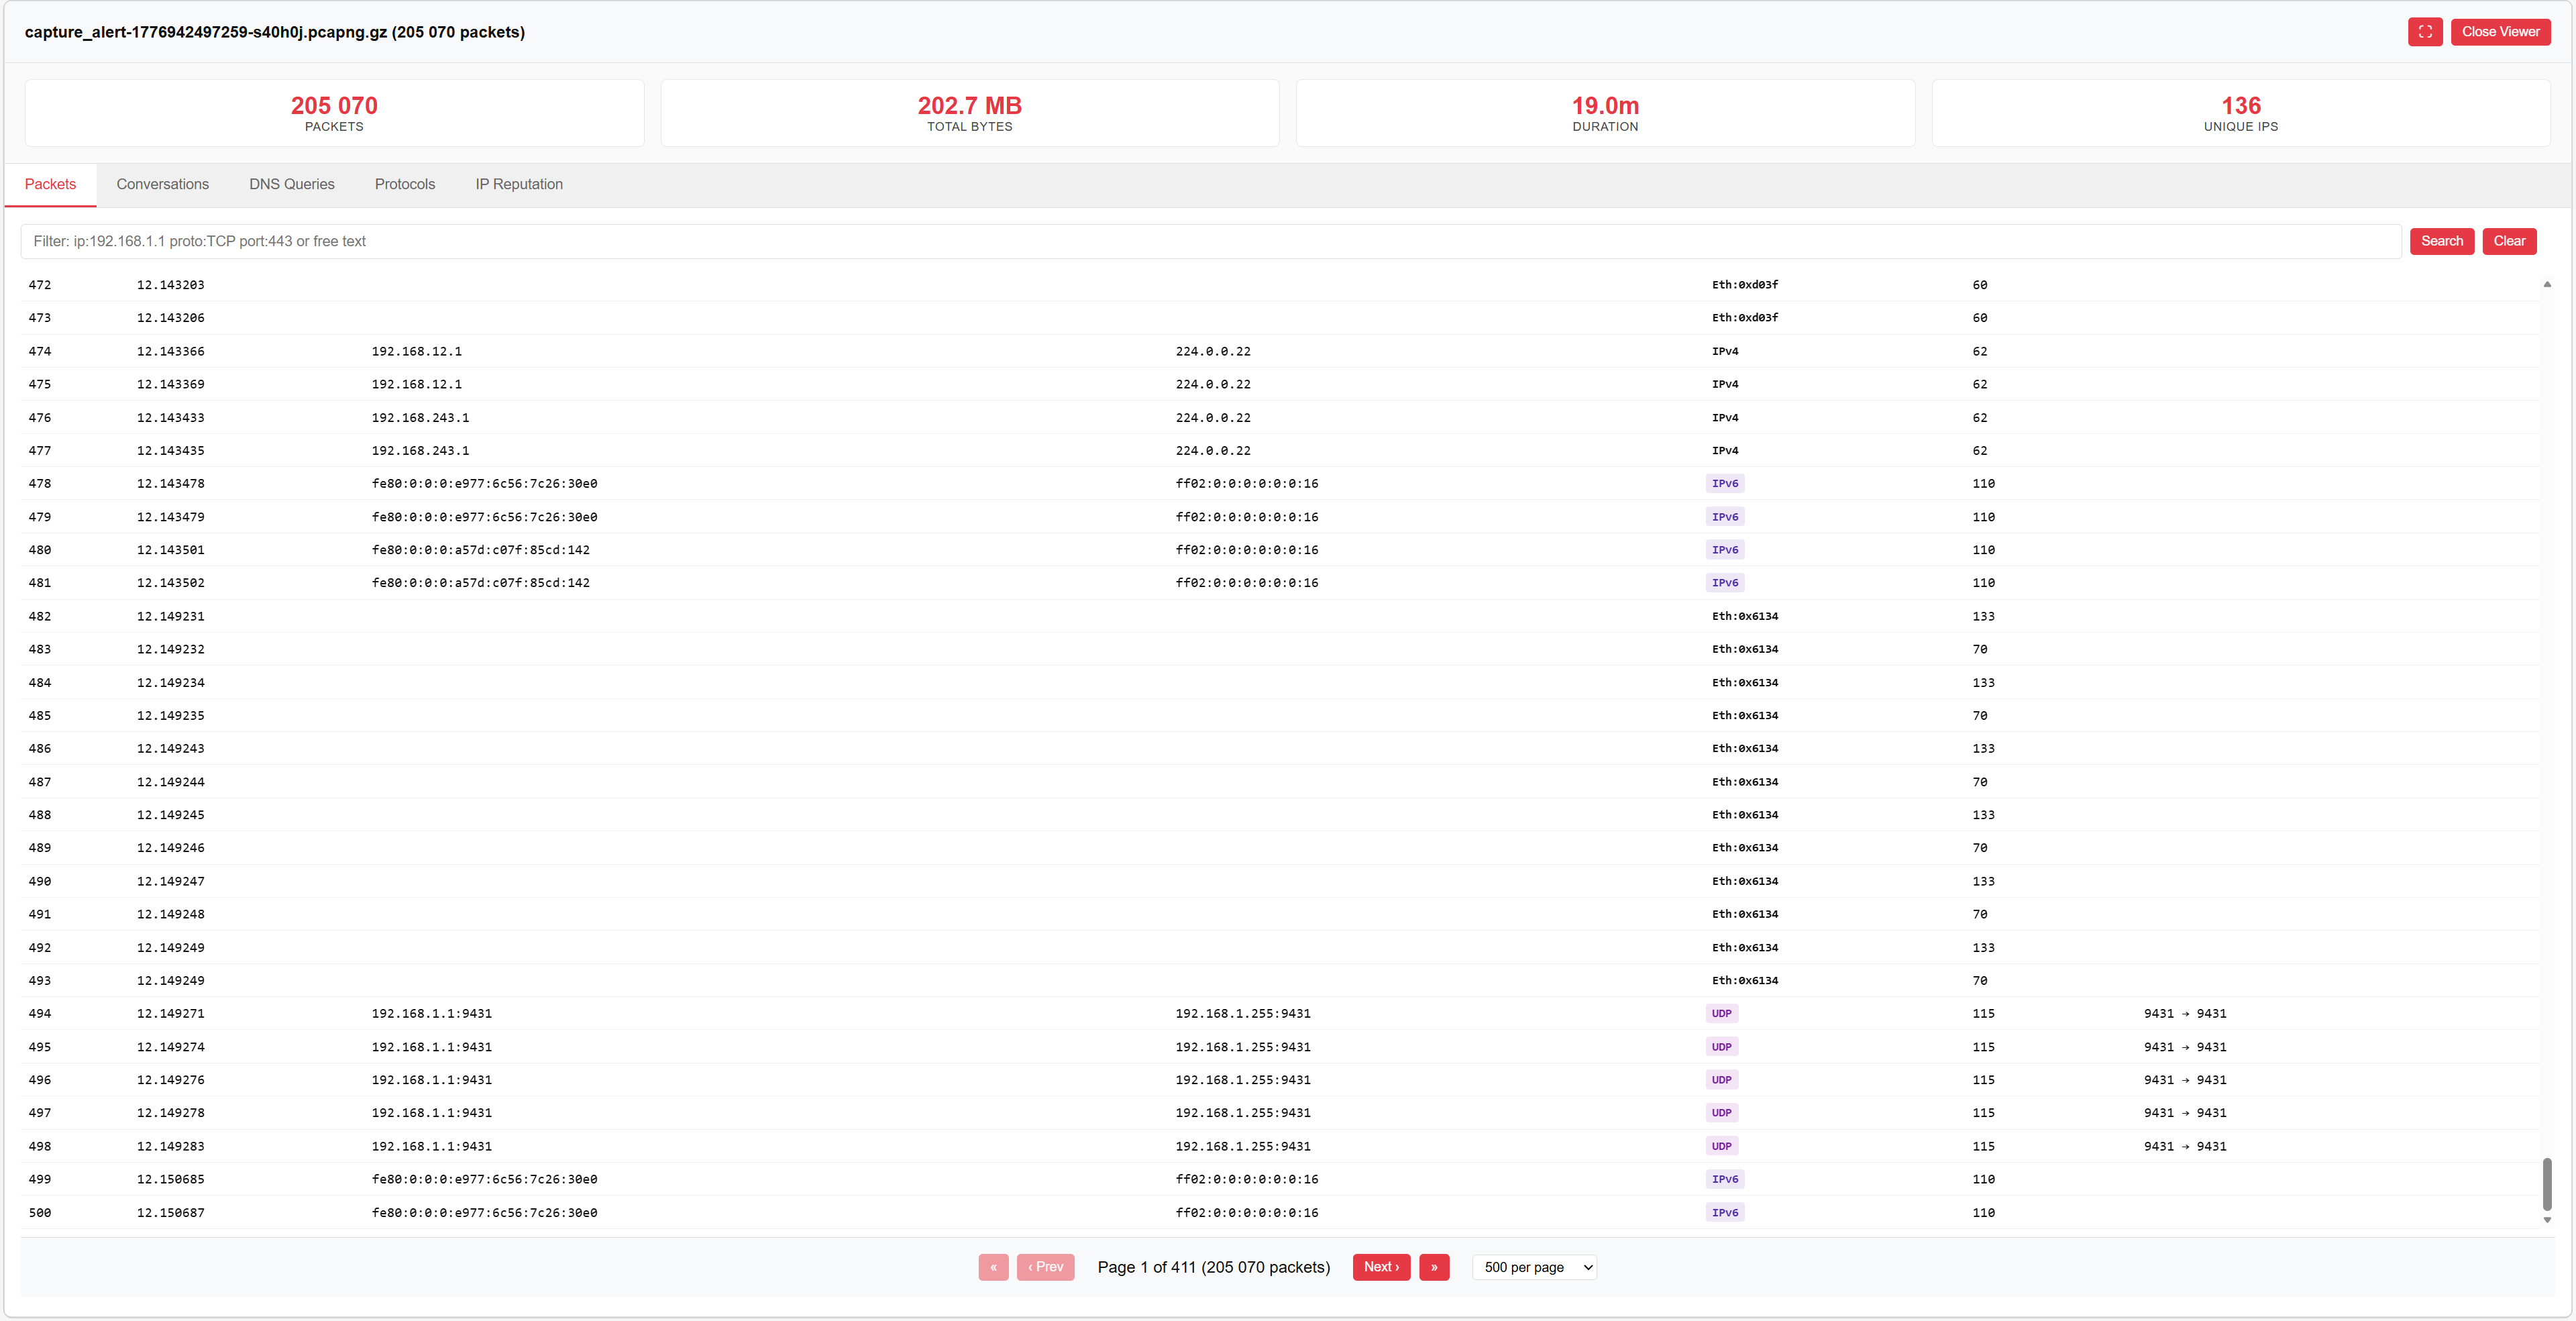
Packet capture analyzer
Review network traffic captured from an endpoint without leaving the portal. No download, no separate tool. Every IP in the capture is auto-checked against threat intelligence, so flagged hosts surface immediately.
- On-demand capture from any enrolled device
- Built-in protocol decoder
- Automated IP reputation scanning, no manual lookups
- Exportable as standard PCAP
Respond from the same screen.
Isolate an endpoint, collect logs, or run a scan with one click, then track the action through to completion.
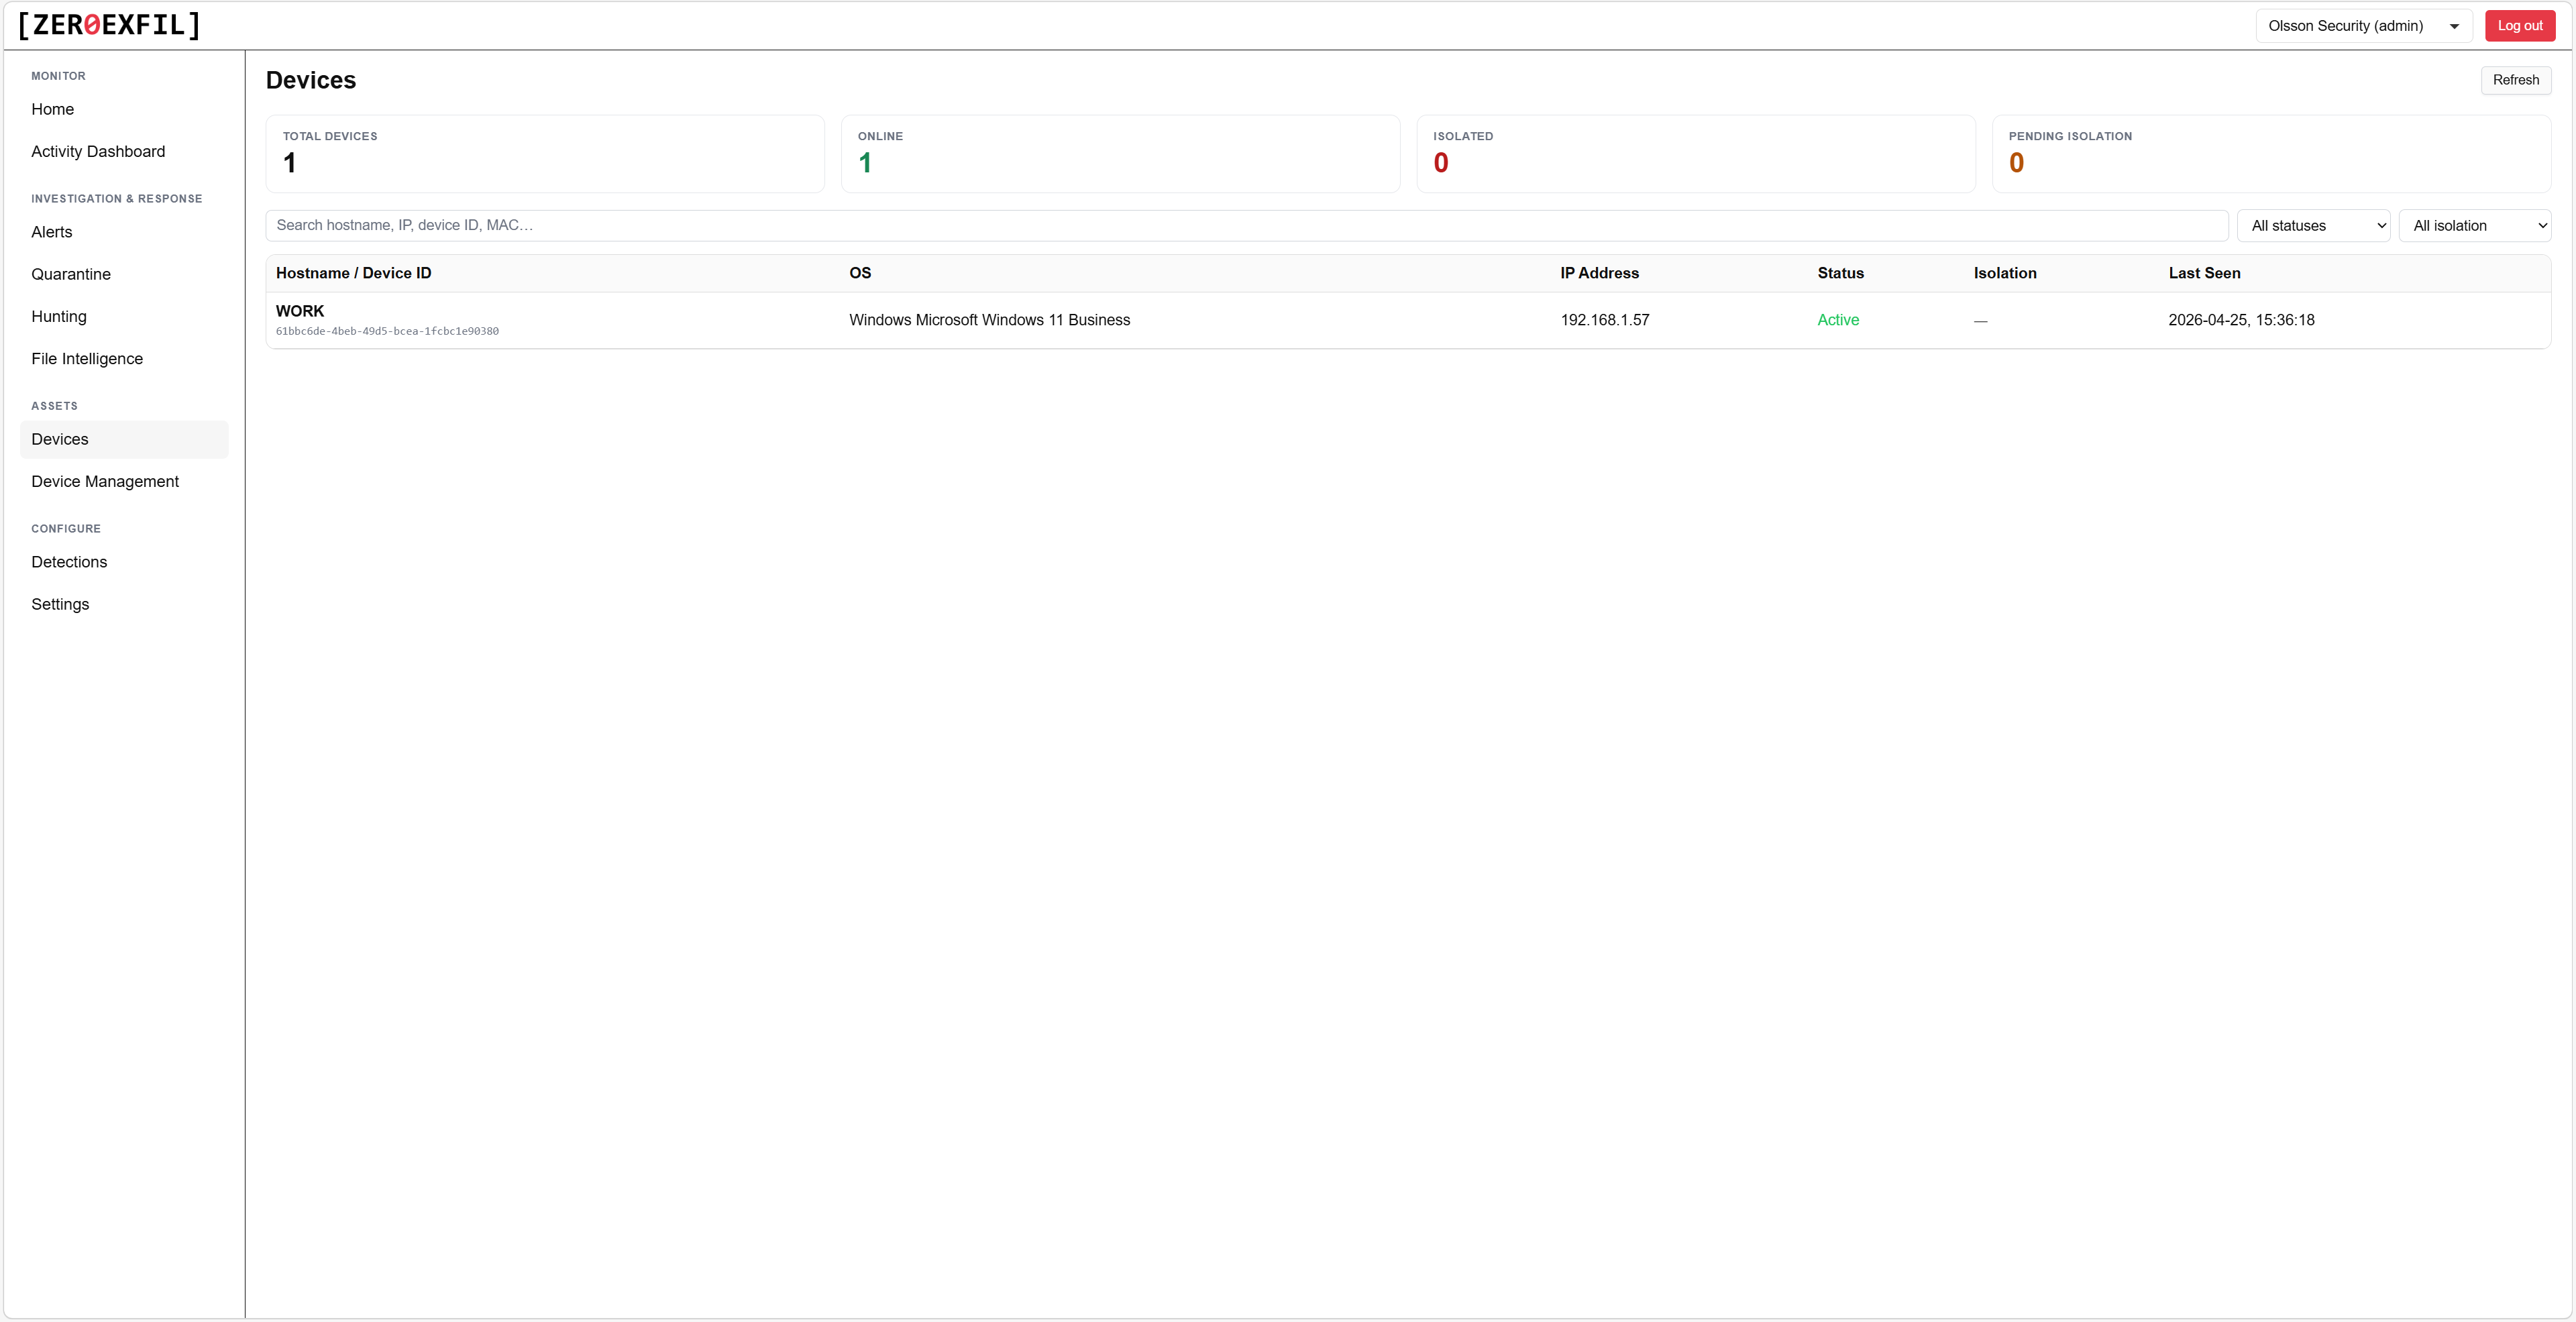
Devices
Endpoint inventory with agent health, last seen, and one-click response actions.
- Network isolate or release in seconds
- Trigger log collection on demand
- Run an on-demand scan from the portal
Tune coverage to your environment.
ZeroExfil ships with dozens of built-in detection rules. Custom rules are coming soon, so you can extend coverage with logic specific to your fleet.
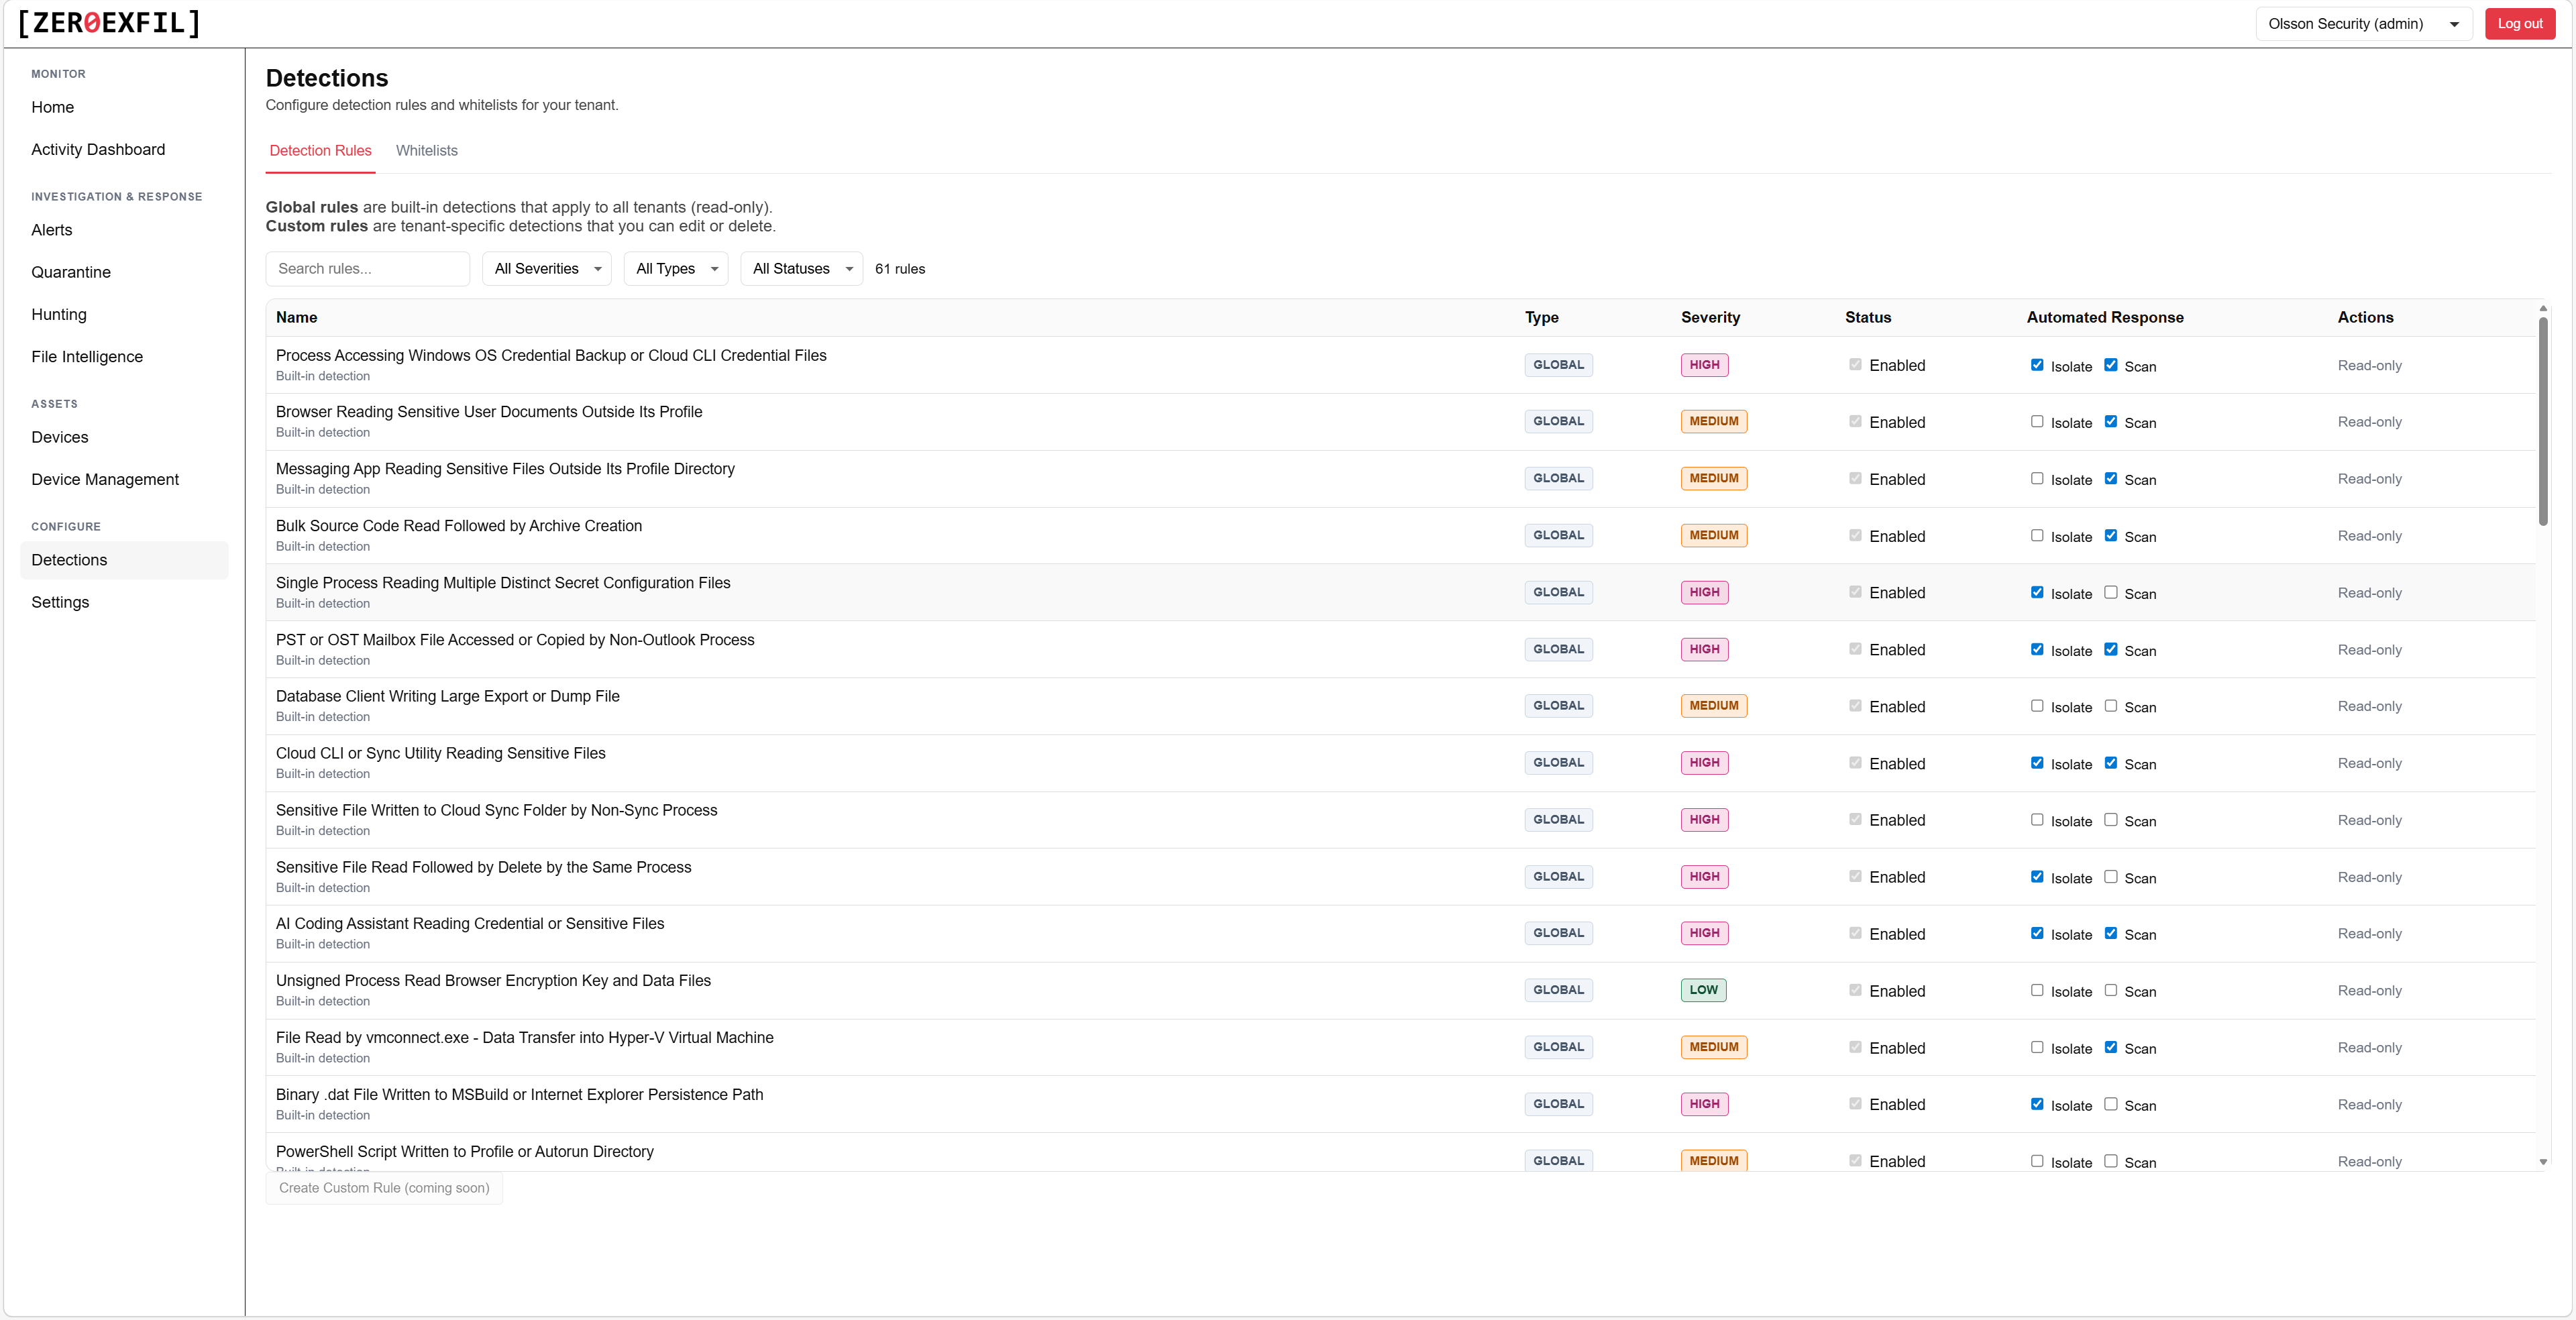
Detection rules
Browse the built-in rule library, see what each rule looks for, and choose the automatic action it triggers, isolate the device, run a scan, or just alert. A dedicated whitelists page lets you suppress common false positives, like a known admin tool or backup process, without disabling the rule itself.
- Dozens of built-in rules across the kill chain
- Per-rule documentation and references
- Whitelist common false positives without losing the rule
- Custom rules coming soon
See it on your own endpoints.
A 30-minute walkthrough with our team. We show you the portal, run a live detection on a test endpoint, and answer your questions.